NCI Cancer Atlas
The NCI Cancer Atlas was designed to enable users to create choropleth maps quickly and easily, with a variety of data types. This page presents an introduction to the application controls and available options.
- Map View Controls
- Data Selection Controls
- Histogram Legend
- Multiple Maps Control
- Print Controls
- Color Ramp Controls
- Table View
Map View Controls
The Data Selection Control (1), Multiple Maps Control (3), Print Control (5), and Color Ramp Control (7) are discussed in subsequent sections.
The Site Navigation toggle button (2) allows you to show or hide the site's header and navigation bar. Using this option can allow you to maximize the screen space available to display map content.
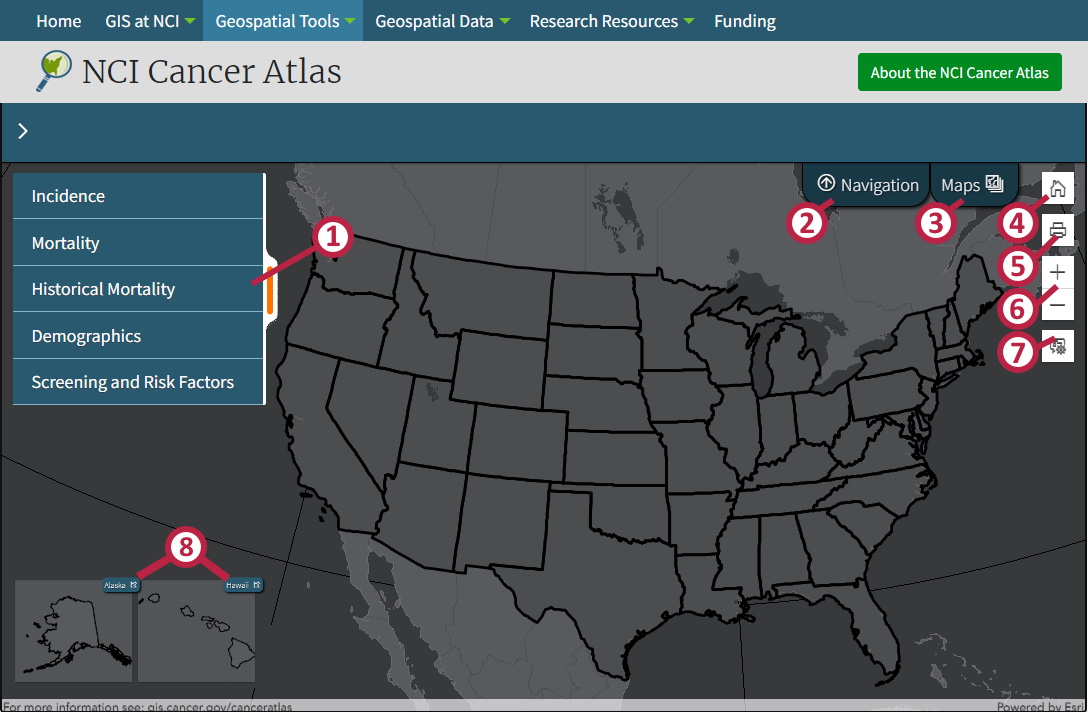
A grey basemap of the United States is shown in the map window when the application opens. You can pan this map by clicking and dragging or with your keyboard arrow keys. Likewise, you can zoom in and out on the map by clicking the Zoom In (+) or Zoom Out (-) buttons (6) near the top right, with your mouse scroll wheel when hovering over the map, or with your keyboard plus and minus keys. You can zoom to an area of interest by holding Shift and dragging a rectangle around that area. Finally, you can return to the initial map location by clicking the Home button (4) in the top right.
When you make a data selection, the Alaska and Hawaii inset maps will display to show information from those non-contiguous areas. You can use the Inset Expand/Collapse button (8) to minimize these windows if they overlap with areas of interest on your map.
Data Selection Controls
The available data selections included in NCI Cancer Atlas are presented in a nested list format. To view options within a topic, click the menu item and the associated sub-selections will be displayed. A selected menu item is indicated with a green tab on the left side of the selection. To unselect an item, click it again to collapse its sub-selections.
In this example, the Incidence button (1) is selected and the All Races (2) sub-selection has been chosen. The third menu level listing available cancer sites has expanded to the right and All Cancer Sites (3) was picked. You can see that all three of these menu options carry the same green selection tab on the left side. The Both Sexes button (4) has not yet been clicked.
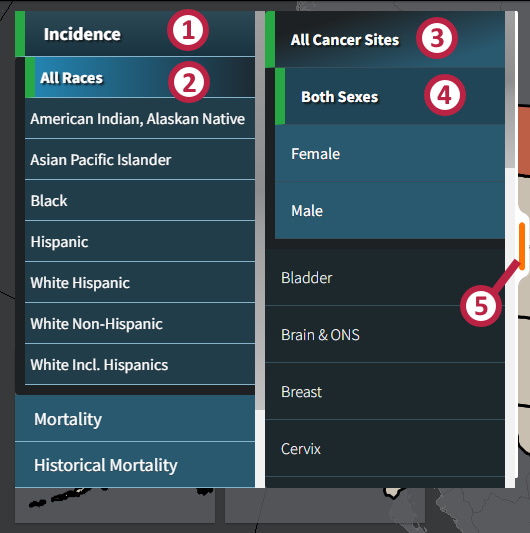
When the final option is selected, the application draws a map displaying the information and the title area updates to reflect the current map content. Most data items require four choices, but in some cases (such as female breast cancer with only one sex selection) the final choices will be automatically set. In any case, when a new data selection is made and the user's cursor leaves the Data Selection Control, the application will minimize the control on the left of the map area. You can retrieve the control or manually minimize it at any time by clicking the orange toggle tab (5) or by clicking on the map's title text.
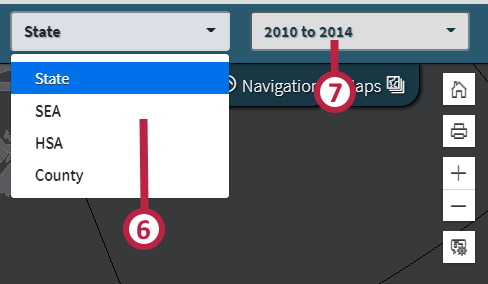
Some data selections will also allow for selection of geographic aggregation. When this option applies, a geography selection box (6) will appear at the right of the title bar and allow you to select from the available administrative levels: State, State Economic Area (SEA), Health Service Area (HSA), County. Likewise, a data year selection box (7) is available only for Historical Mortality data selections and will appear when appropriate and allows you to select from a range of data time periods.
Histogram Legend
The NCI Cancer Atlas uses a continuous ramp symbology to visualize all the available data selections. This means that areas are not classified into discrete groups on the map. However, the legend does represent the data in a histogram format to help explain the data's distribution.
The histogram legend is created with a variable number of bins dependent on the selected data's geographic aggregation. Aggregations with more areas (counties) will result in more bins and those with fewer areas (states) result in fewer. The control is labeled with the legend unit (1) at the top as well as the minimum and maximum (2) values at the bottom. Each bin's center value is displayed when you hover over it. You can minimize the legend by clicking in the unit label (1). The legends are automatically minimized when the tiled display option is chosen from the Multiple Maps Control.

In addition to showing the distribution of data, the histogram legend can be used to filter areas drawn on the map. Simply click on a bin (1) and only the areas which fall within that bin remain displayed on the map. Click another bin (2) to see the areas within that one. Click on the same bin which is already being shown again to unselect and remove the filter.

Multiple Maps Control
Up to four independent maps can be added to the application and corresponding buttons labeled "Map" 1-4 (1) will appear in the multiple maps dropdown list. If there are fewer than four maps an Add Map button (2) is available which will create a new blank map. The final menu option, the Tile Maps button (3), will display all the currently created maps side-by-side. To exit this view, open the Multiple Maps control again and select any single map (1) to view.
The Delete Button (4) will appear on the selected map and clicking it will remove the map from the application. The remaining maps will not be renumbered, and if another map is created later it will use the lowest index available.
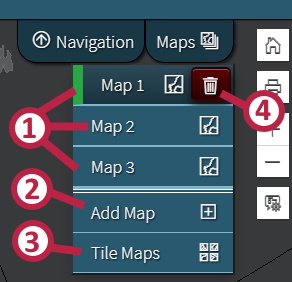
The map extents are synched, so when you pan or zoom in one map that change is reflected in all the maps. It is important to note that each map has an independent Data Selection Control, so you will need to make additional data selections on each new map. The Multiple Maps control will be disabled on certain smaller screen sizes to avoid performance issues associated with those devices. Please open the NCI Cancer Atlas on another device to use this feature.
Print Controls
The Print Control widget is toggled open and closed with the button at the top right of the map view. This widget contains many options for outputting high quality representations of the displayed map. At the top of the widget are tabs indicating Layout (1) or Map Only (6) options. The layout export will create a map within a frame allowing space for a title, legend, scale bar, and footnotes. When this mode is selected an option for Title (2) allows you to modify the default title if you wish. This text will also be used to create a descriptive file name. There is an option for Page Setup (3) which will dictate the dimensions of the layout, and an option to select the File Format (4) output type: PDF, JPG, PNG.
The Map Only option will simply export the map area with no additional information. There is a File Name (7) option which you can modify, but unlike in Layout mode, this text will not appear on the map. There are also Width and Height (8) settings which indicate how large of a map segment you want to export. The units are in pixels and your optimal settings will depend on how much of the map you want to include.
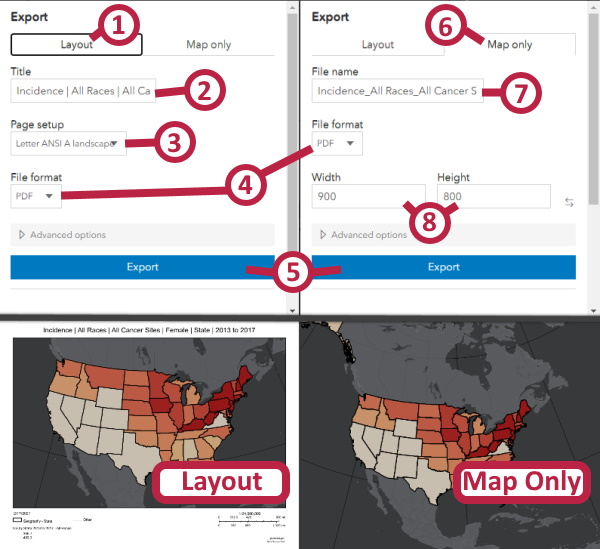
Both map types include an Export button (5) which will send your export request to the server. You'll see the status in the Exported files list beneath the button and when it is complete there will be a clickable link for you to download your file.
Color Ramp Controls
The Color Ramp Controls are opened and closed with a toggle button (1) at the right of the map view. These controls allow you to quickly change the continuous color ramp used to display your selected data. Simply click on the map color ramp (2) you'd like to use. The map and legend will immediately update when you choose a new color ramp; if it does not update, open the data selection control and try making your selection again.
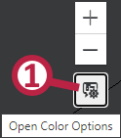
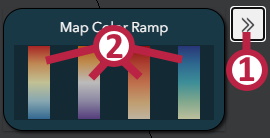
Table View
The NCI Cancer Atlas' data selections are available in a separate Table View page. You can open that page directly and make a selection with the boxes at the top to see the information listed as a simple table with the option to download it as a CSV file.
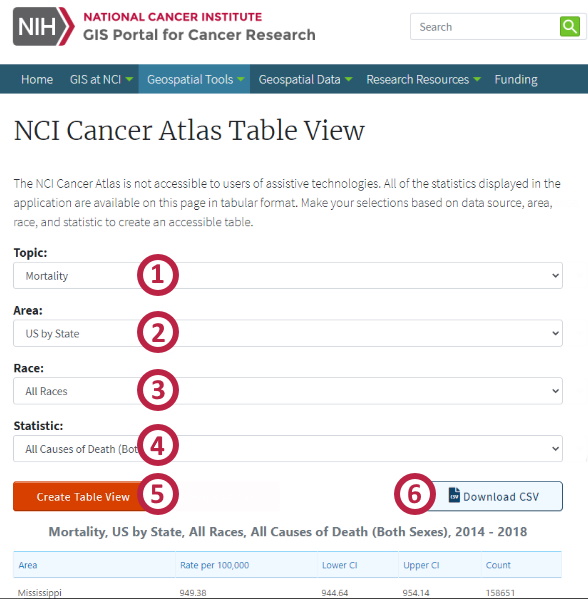
The Topic (1), Area (2), Race (3) and Statistic (4) controls are analagous to the selections presented in the Atlas' Data Selection Control. Each selections' options are dependent on the previous one and can vary depending on data type and availability. Sometimes options will be automatically selected or disabled. Once you have made a selection you can submit it by clicking the Create Table View button (5). This will create a table on the page which lists the statistic for each geographic area. Once a table is created the Download CSV button (6) button will appear which can be used to save the table information to a file on your computer.
Start Using NCI Cancer Atlas
This concludes the NCI Cancer Atlas Introduction. For information on data available within the application, see the list on the Cancer Atlas About page. If you still have unanswered questions or issues please contact us via the form or email provided on our Contact page.
