How NCI Uses GIS
NCI is continuously exploring opportunities to augment its already extensive geospatial infrastructure, enhance the quality of reported cancer information, and support more comprehensive analyses of cancer burden, cancer risk, and outcomes. Geospatial methods and tools have been developed to facilitate spatio-temporal data linkages, analysis, and visualization.
Recent Initiatives
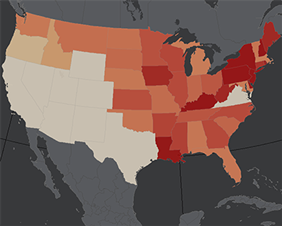
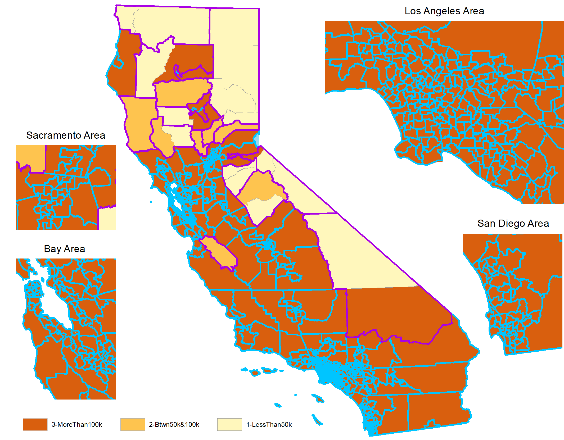
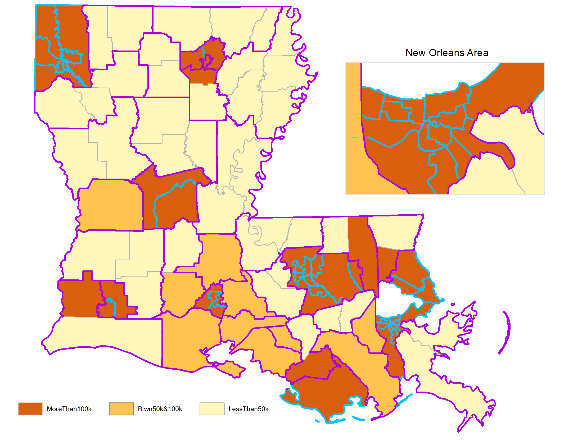
NCI/NAACCR Zone Design Project
NCI, in collaboration with the North American Association of Central Cancer Registries (NAACCR), is working with individual cancer registries to develop a set of cancer reporting zones across the U.S. that are more suitable for cancer data reporting than counties. The project utilizes automated zone design procedures to create coherent, socio-demographically homogeneous areas for cancer data reporting and analysis with populations that are large enough to support stable cancer rates and minimize suppression. To learn more about the project and methodology, see the article Developing Geographic Areas for Cancer Reporting Using Automated Zone Design .
.
Click images to enlarge
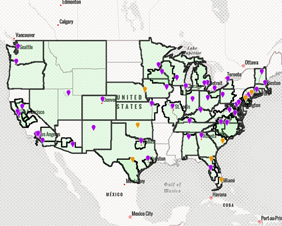
SEER-Address Record Linkage and Residential Histories Project
Cancer registries routinely collect the patient's residential address at the time of diagnosis. However, historical and updated address histories are not generally available. Having residential history pre- and post-cancer diagnosis would facilitate data linkages with multiple sources of longitudinal data, enhance the quality of data linkage in the absence of patient identifier information, and provide research opportunities including investigating exposures to neighborhood social and environmental conditions with risks of developing cancer.
NCI’s Surveillance Research Program (SRP) obtained historical residential address information of over 3 million SEER patients from a commercially available data source. The database contained duplicate addresses and other inconsistencies that had to be reconciled. SRP sponsored the development of Residential History Generation Programs (ResHistGen), a set of open-source SAS programs for reconciling address data from commercial vendors and generating continuous residential histories month-to-month. The programs and supplementary documentation are available on GitHub.
SRP is currently working on the linkage of residential histories of SEER patients to longitudinal environmental exposure measures to facilitate analysis of the impacts of environmental exposure on cancer risk, outcomes, and survivorship issues.
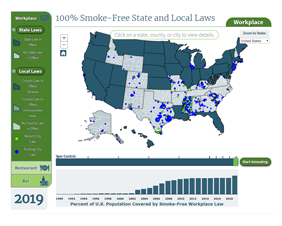
Interactive Cancer Surveillance Geovisualization Tools