Accumulating Data to Optimally Predict Obesity Treatment (ADOPT) Core Measures: Environmental Domain
The National Heart Lung and Blood Institute (NHLBI) led Accumulating Data to Optimally Predict Obesity Treatment (ADOPT) Core Measures Project identified a standard set of about 50 Core Measures, or factors, that can be analyzed across studies to better understand the variation in response to obesity treatments. The ADOPT Project encourages and facilitates the consistent use of these Core Measures in future clinical trials to treat obesity in adults. The Core Measures are classified into four major domains: behavior, biology, environment, and psychology (Maclean et al. 2018 Obesity 26:S6-S15 ).
).
The environmental domain subgroup of the project sought to identify a parsimonious set of objective and perceived neighborhood and social environment constructs and corresponding measures to include in the assessment of response to adult weight‐loss treatment (Saelens et al. 2018 Obesity 26:S35-S44 ). One project to date has used the recommended objective environmental measures to examine their associations with responses to a weight loss intervention (Tewahade et al. 2022 Obes Sci Pract. 9:261-273).

The ADOPT Environmental domain subgroup recommended measuring the following GIS-based environmental constructs: walkability, food outlet accessibility, socioeconomic deprivation, personal safety, and urbanicity. The data files here are geographic data for standard Census Bureau administrative units. Most are available for Census Tracts: areas designed to have about 4,000 people and generally homogeneous population characteristics. The walkability data is also available for Census Block Groups: smaller areas with about 1,500 people. The ADOPT core measures environmental group recommends analyses of response to weight loss interventions using these GIS data layers along with the perceived environmental measures and the other measurement domains. For example, response to interventions that included walking as part of the intervention might be greater in more walkable neighborhoods or lower in neighborhoods with more crime. Descriptions and usage guidelines are provided for each of the recommended spatially identified data layers below. The data are also described in an article for ease of citation (Slotman et. al. 2022 Data Brief 41:108002).
Walkability
Environmental Protection Agency National Walkability Index
The National Walkability Index dataset characterizes Census block groups and tracts based on their relative walkability. The Walkability Index is based on data from the EPA's Smart Location Mapping project which includes a National Walkability Index for census block groups (Thomas and Zeller, 2017). This index is associated with self-reported transportation walking and to a lesser extent, leisure walking (Watson et al. 2020 ). The block group data from the EPA have been aggregated to provide a similar walkability index at the census-tract level. In 2021, EPA released a new version of the Smart Location Database and we provide the block group and census-tract level walkability index that correspond to the previous walkability index (2013) and the current walkability index (2019).
Access the walkability data files, codebook, and methods summary.
Socioeconomic Deprivation

Neighborhood Deprivation Index
A Neighborhood Deprivation Index (NDI) for each Census tract in the U.S. was created using factor analysis to identify key variables from 13 measures in the following dimensions of socioeconomic (SES) status: wealth and income (median household income; percent of household receiving dividends interest or rental income; percent of households receiving public assistance; median home value; percent of families with incomes below the poverty level), education (percent with a high school degree or higher; percent with a college degree or higher), occupation (percent in a management, business, science, or arts occupation; percent unemployed), and housing conditions (percent of households that are female headed with any children under 18; percent of housing units that are owner occupied; percent of households without a telephone; percent of households without complete plumbing facilities).
Notes
- In August 2022, we corrected an error in the original calculation of the NDI index. The NDI values themselves are similar (the mean absolute difference is 0.3) and the range of the corrected values is greater (-3.6 to 2.8 versus -2.5 to 1.9). The NDI quintile values for 77% of US tracts did not change with 21% only differing by a single quintile. Corrected data files have been posted below.
- Dr. Ian Buller (NCI, DCEG) has recently posted an open-source R package
 that computes various neighborhood deprivation indices (NDI) . The available indices include the NDI measure recommended by the ADOPT group Slotman et al. (2022)
 which uses variables chosen by Roux and Mair (2010)
 . All are based on multiple demographic characteristics from the U.S. Census Bureau American Community Survey 5-year estimates.
Access the socioeconomic deprivation data files, codebook, and methods summary.
Personal Safety

We obtained crime data from one of several resources that compile and sell data from national and local sources in order to provide an example that illustrates tract-level crime rates.
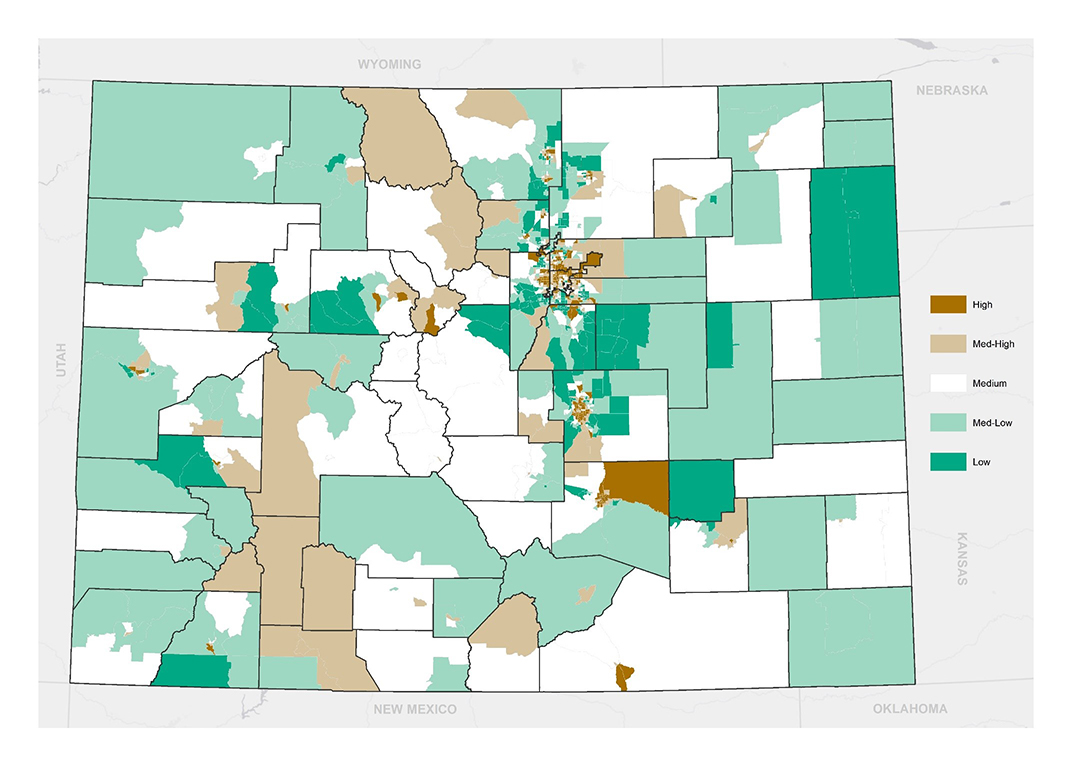
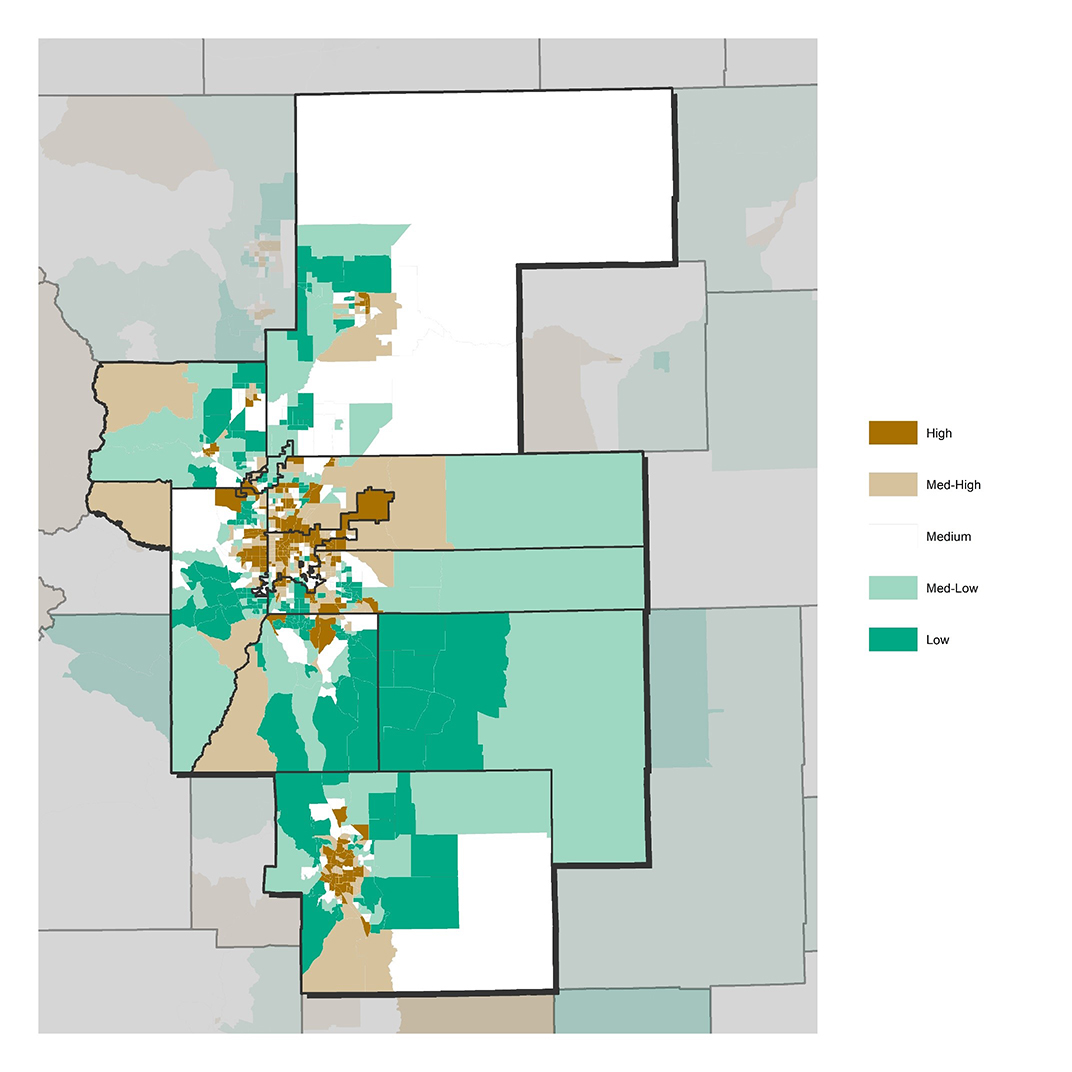
To produce this example, we purchased Applied Geographic Solutions (AGS)’ CrimeRisk data for the state of Colorado. Data from AGS originates from underlying local and federal data and is just one of several companies that process such data for users. AGS crime risk data sets include county names, population, total crime, personal crime (murder, rape, robbery, assault) and property crime (burglary, larceny, motor vehicle theft) by census tract. One approach to incorporating these data into an analysis of a weight loss intervention is to calculate a crime level for each census tract in your dataset. Then study participants could be assigned a crime quintile and analysts can produce a map or regression model.
Here we illustrate such a map for Colorado by tract and for the eleven counties in which study participants reside. This illustration is not intended as an endorsement or based on a quantitative assessment of the data resources they or other companies use.
Access the methods summary for calculating quintiles used in the above example.
Urbanicity

We provide two tract-level urbanicity measures, one based on the latest USDA rural-urban commuting area (RUCA) codes (2010) and one based on the high level National Center for Education Statistics (NCES) urban/rural locale definitions applied to 2010 Census urban/rural data. The RUCA-based measure describes the types of nearby cities and towns based on commuting patterns and characterizes general access to services typically found in urban areas. The NCES-based measure based on the NCES urban/rural locale definitions more closely corresponds to the rural/urban nature of the immediate environment.
Access the urbanicity data files, codebook, and methods summary.
Food Outlet Accessibility

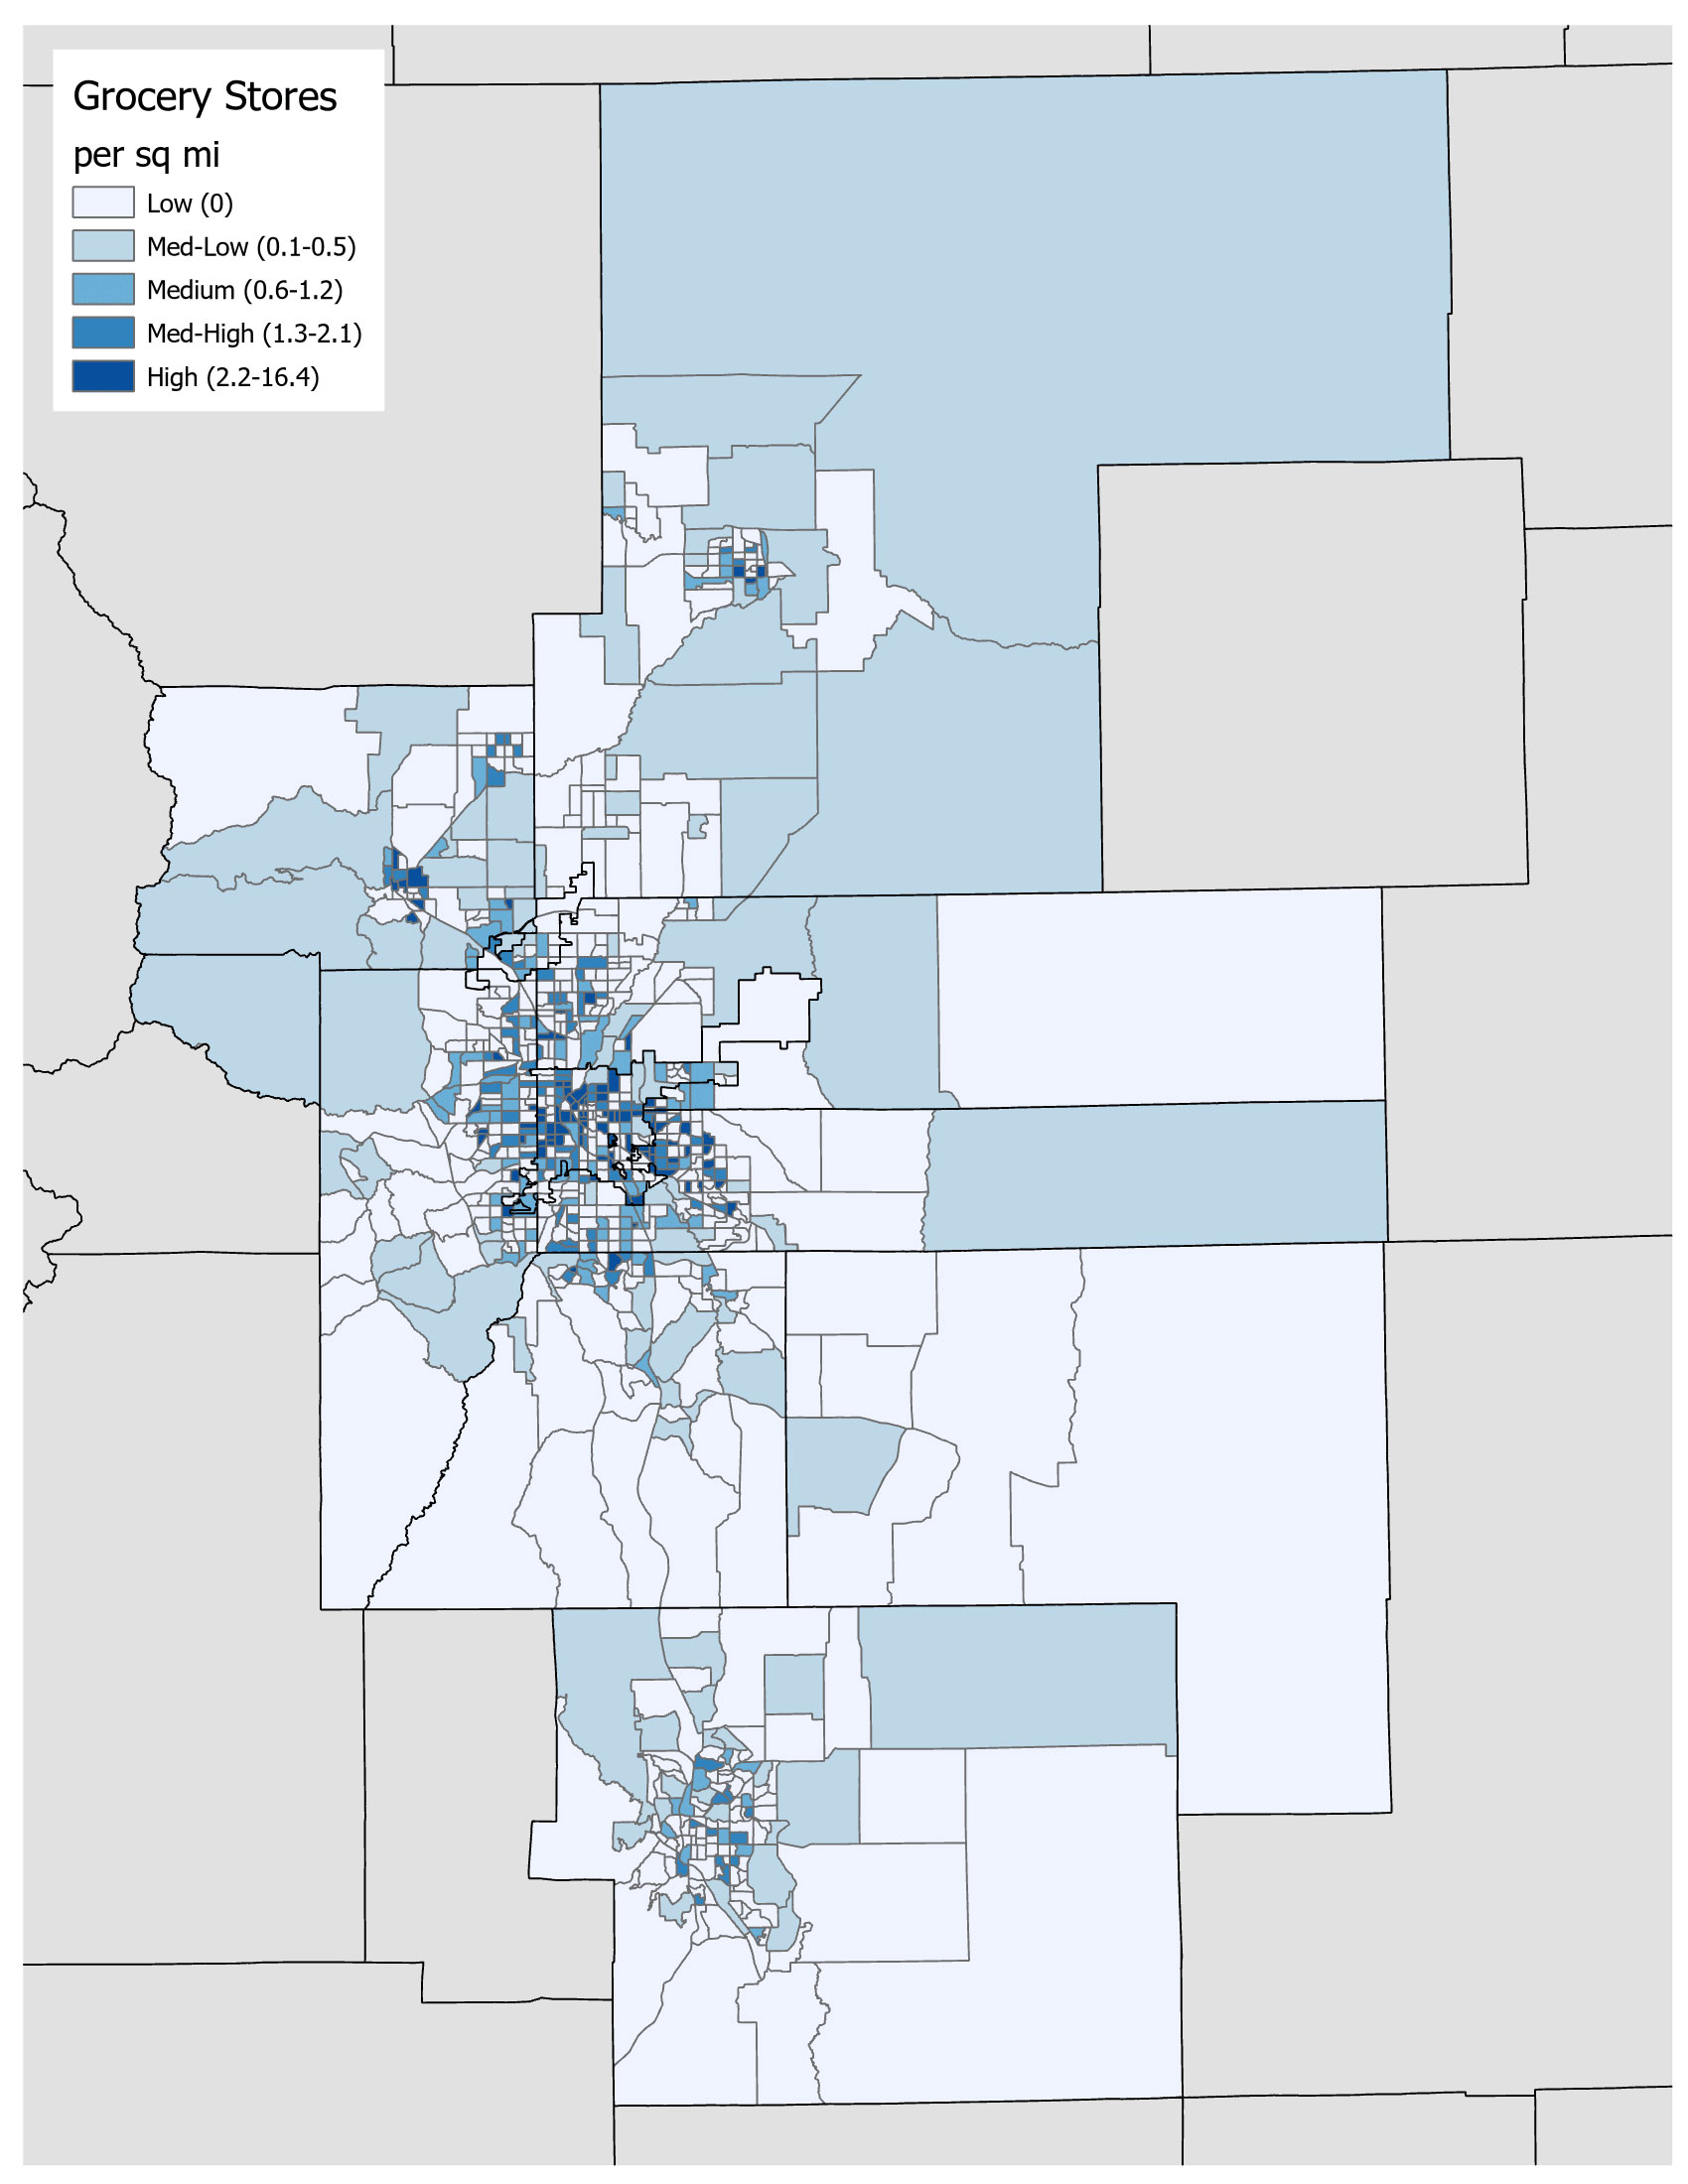
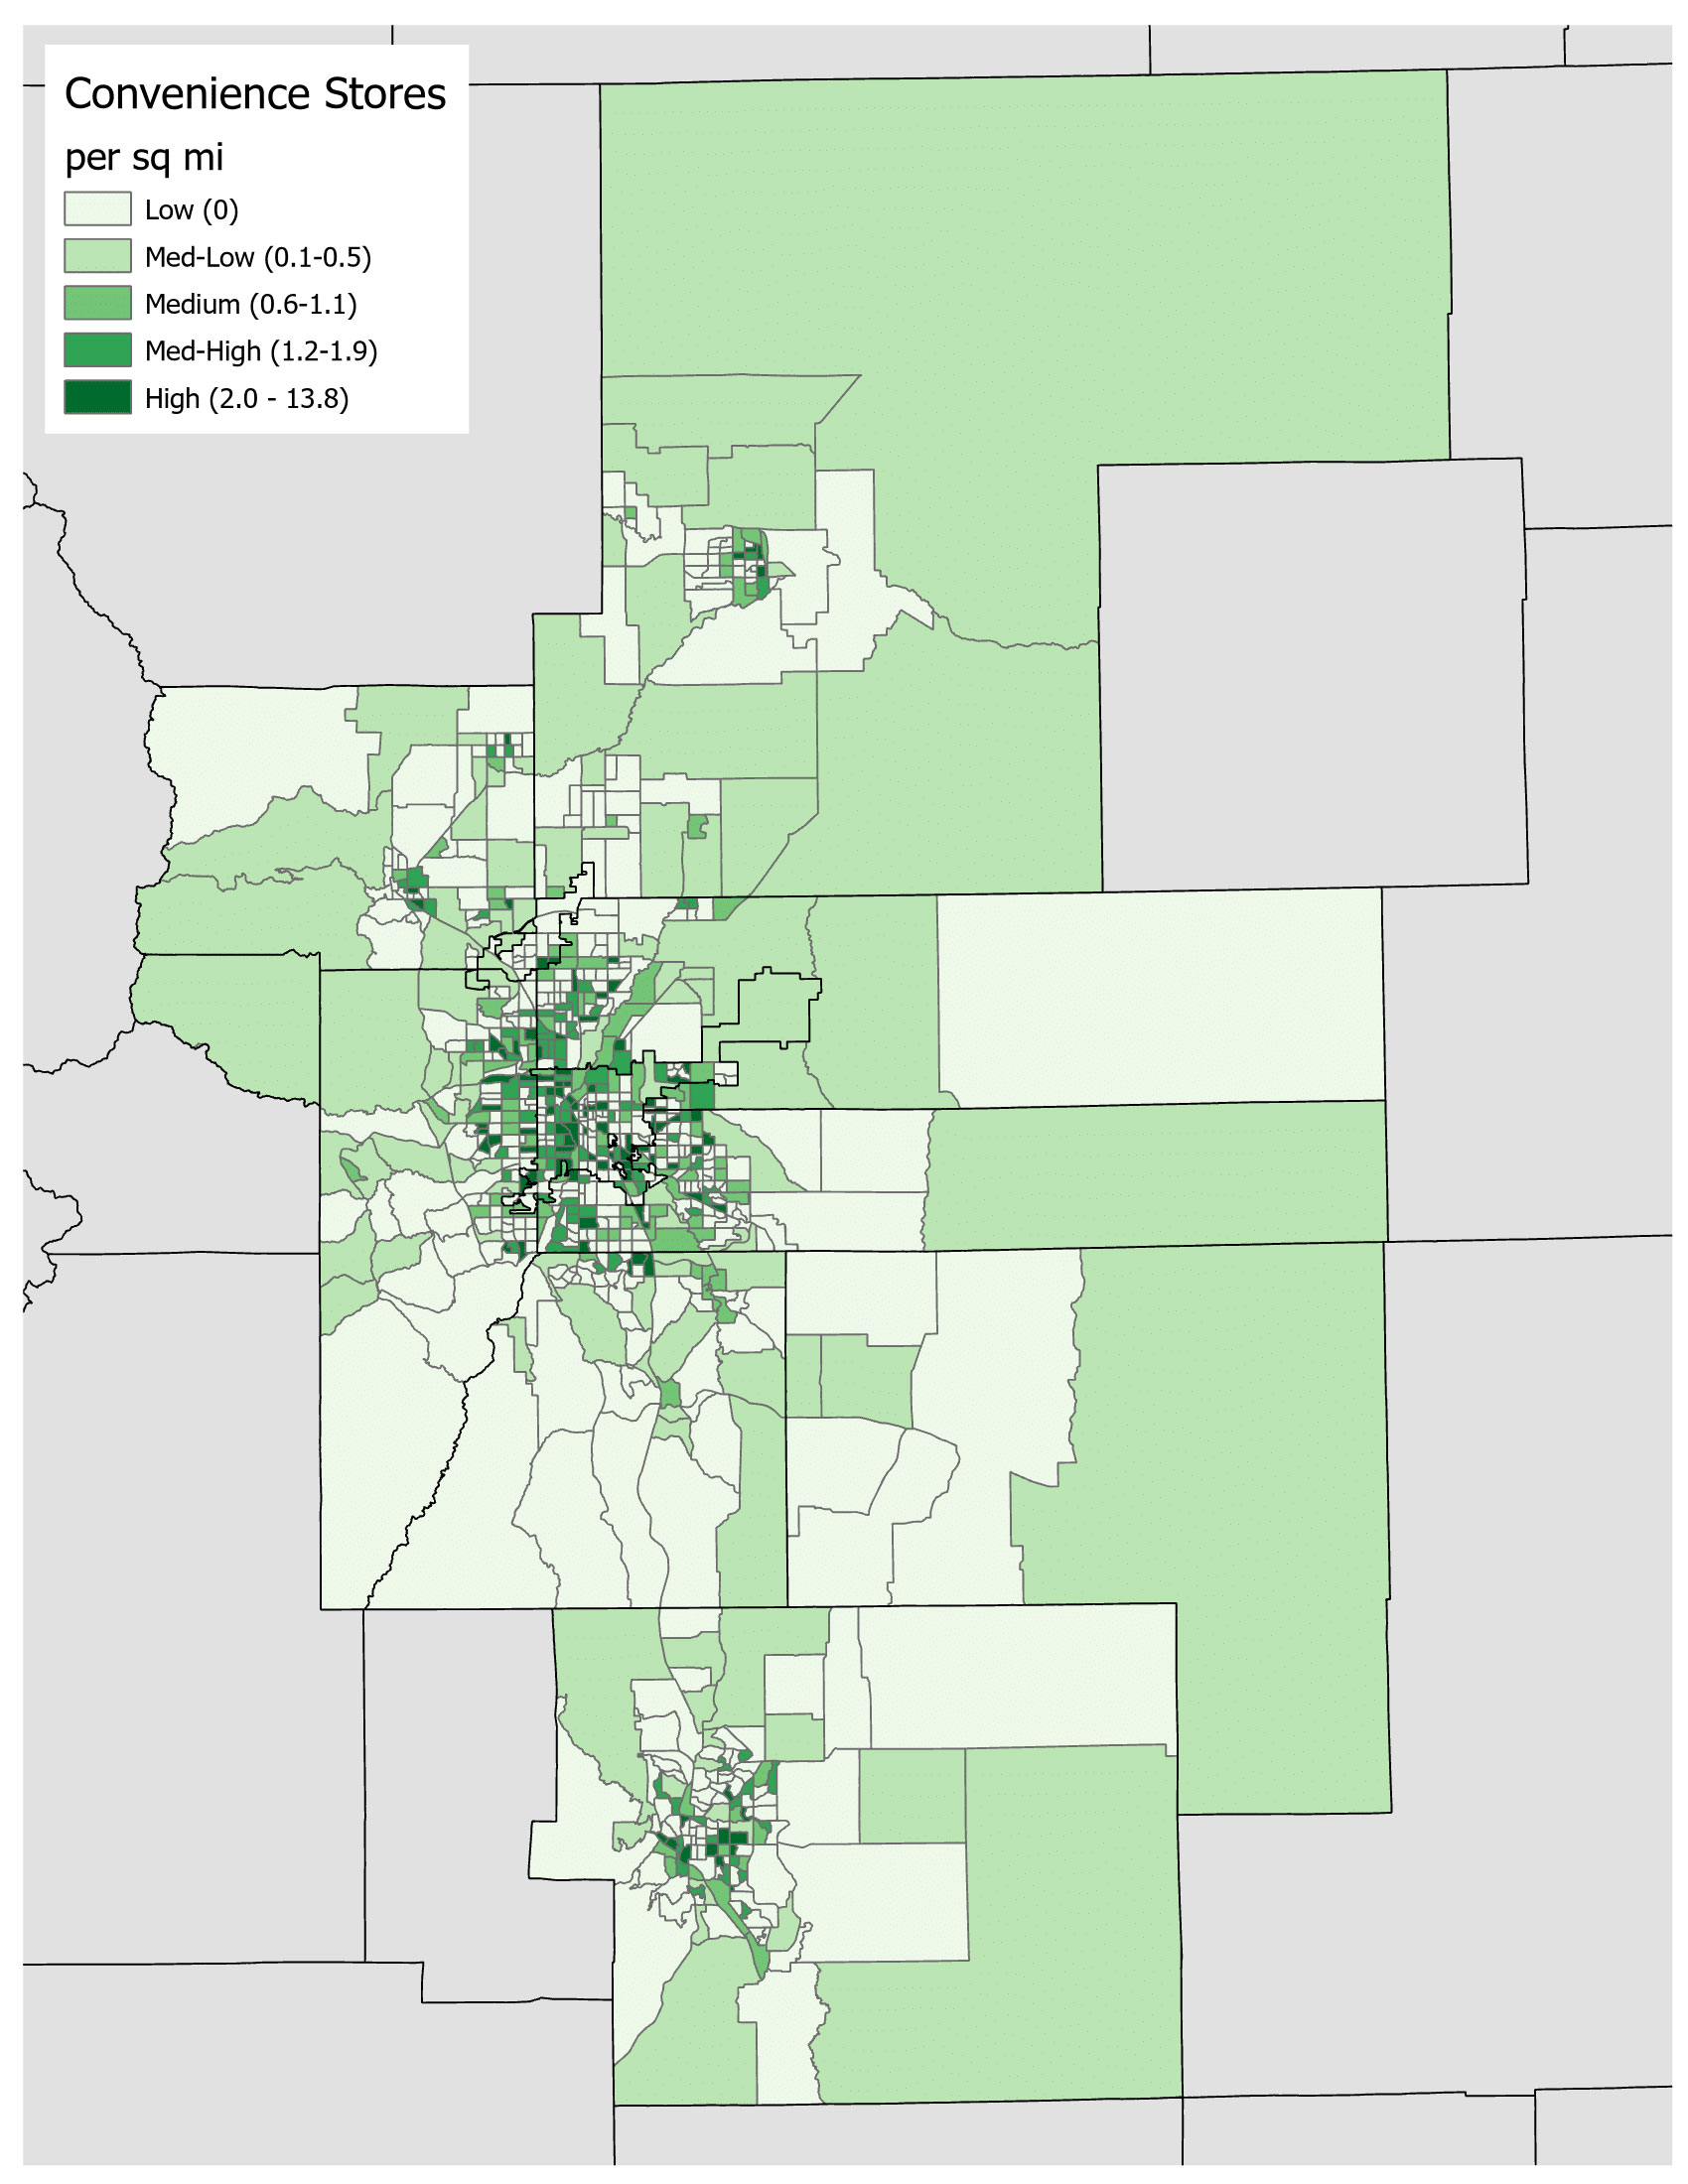
In order to provide an example that illustrates tract-level density of grocery stores, fast food restaurants, and convenience stores, we followed the process outlined in Jones, et al. (2017) and obtained historical commercial business listings for the specified Standard Industrial Classification (SIC) codes and chain names from the year 2019 for the state of Colorado from InfoUSA®
 (now called Data Axle USA®) and Dun and Bradstreet
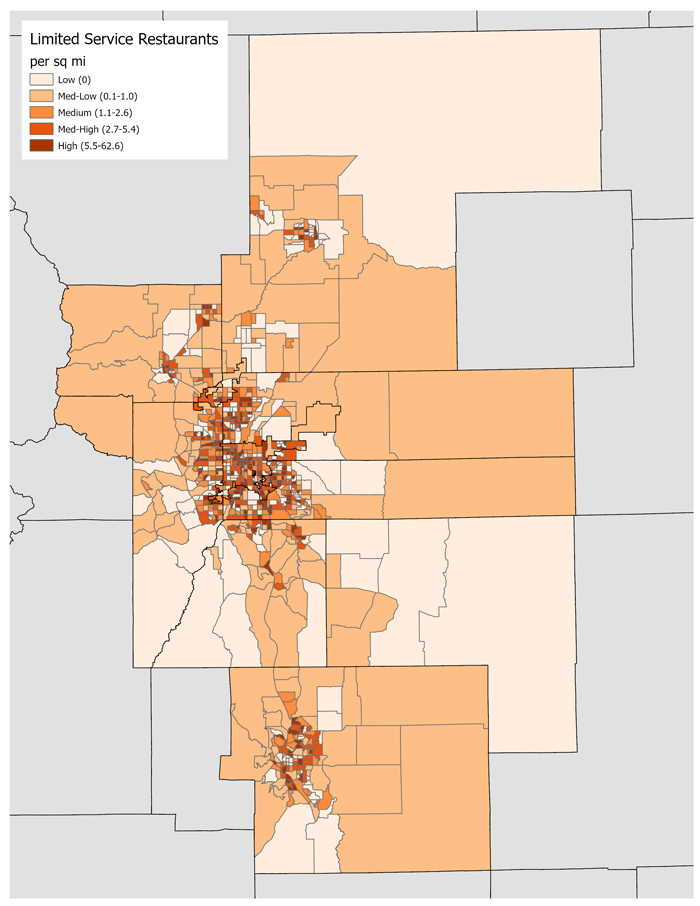
 . The data we received included a variety of variables including company name and address, contact information, employee size, sales volume, SIC code(s) and others (see Appendix A in methods document for a complete list of variables). To understand the impact of food outlet accessibility on weight loss trials, the ADOPT working group recommended measuring the density of outlets within a given area around the participant’s home and distance to the closest outlet. Here, we illustrate density of grocery stores, convenience stores, and limited service restaurants by census tract for eleven Colorado counties that were also used in our illustration of crime and safety data. Researchers interested in following the ADOPT Environment recommendations more precisely would have to use GIS to identify the food outlets in buffers around their respondent homes.
Access the methods summary and supporting documentation used in the above example.
